2026-07-04
Dividend and Income ETFs in a Crash: SCHD, JEPI, VYM vs the S&P 500
By FinScope Research · Data as of 2026-07-02
Income funds get sold on a promise of safety. Steady dividends, lower-volatility holdings, “sleep at night.” The pitch is that when the market falls, these hold up better. Sometimes true, sometimes not, and the only way to know is to measure what actually happened in the crashes we have data for.
We ran SCHD, JEPI, and VYM against SPY through the two most recent stress tests: the COVID crash of 2020 and the 2022 bear market. One honesty note up front, because it matters: JEPI did not exist before May 2020, so it has no COVID-crash history at all. Any comparison that includes JEPI in the 2020 column is inventing data. We leave that cell blank.
COVID crash: everything fell together
Maximum drawdown inside the February–April 2020 window, computed from each fund’s daily closes.
| Fund | COVID crash drawdown | Note |
|---|---|---|
| SCHD | −32.8% | dividend-growth screen |
| VYM | −34.6% | high-dividend broad |
| SPY | −33.7% | S&P 500 benchmark |
| JEPI | n/a | launched May 2020, no data |
This is the uncomfortable truth about a liquidity-driven crash. In February and March 2020 everything sold off at once, and dividend screens offered almost no protection. VYM actually fell more than the S&P 500, because high-dividend baskets lean toward financials, energy, and other economically sensitive sectors that got hit hard. SCHD, with its quality-and-dividend-growth filter, held up marginally better than SPY, but “marginally” is the word: 32.8% versus 33.7% is not the safety the marketing implies. When correlations go to one, a dividend does not save you.
2022 bear: this is where income earned its keep
The 2022 sell-off was slower and rate-driven, and here the income funds did their job.
| Fund | 2022 drawdown | vs SPY |
|---|---|---|
| JEPI | −13.7% | 10.8 pp shallower |
| VYM | −15.8% | 8.7 pp shallower |
| SCHD | −16.8% | 7.7 pp shallower |
| SPY | −24.5% | benchmark |
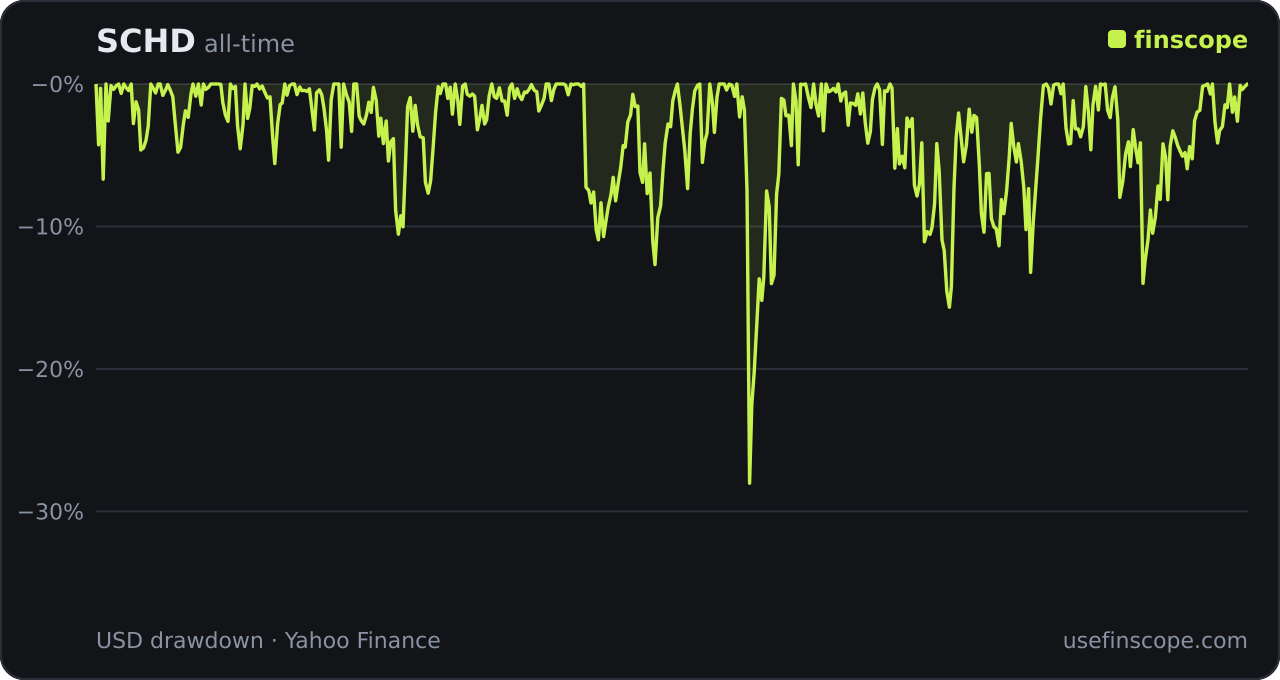
Every income fund beat the S&P 500 in 2022, and by a meaningful margin. SPY fell 24.5%; SCHD held its loss to 16.8%, VYM to 15.8%, and JEPI, now with real history, to just 13.7%. The reason is structural. 2022 punished expensive, long-duration growth stocks, the exact names these value-and-income funds underweight. JEPI’s covered-call overlay added another cushion: selling options generates income that partially offsets a falling market, which is precisely the environment covered calls are built for.
So the two crashes tell opposite stories, and both are true. A fast, panic-driven crash (2020) flattens dividend funds along with everything else. A valuation-and-rate reset (2022) is where they shine, because the pain is concentrated in the stocks they don’t own.
The full record
Zoom out to each fund’s entire history and the picture fills in.
| Fund | History since | All-time max drawdown | Trough |
|---|---|---|---|
| SCHD | 2011-10 | −33.4% | 2020-03-23 |
| JEPI | 2020-05 | −13.7% | 2022-09-30 |
| VYM | 2006-11 | −57.0% | 2009-03-05 |
| SPY | 1993-01 | −55.2% | 2009-03-09 |
The standout warning is VYM. Its worst-ever drawdown is −57.0%, slightly deeper than SPY’s, and it came in the 2008 financial crisis, a period SCHD and JEPI are both too young to have lived through. High-dividend baskets were overweight the banks at the center of that crash. If your read on “income ETF” is “safer than the market,” VYM’s 2008 record is the counterexample: in the wrong crisis, a yield tilt can be a bank-and-cyclical tilt, and it falls just as hard.
JEPI’s shallow −13.7% all-time drawdown looks fantastic, but remember it has only existed since 2020. It has never seen a 2008 or a dot-com. Judge it on the crash it survived (2022), not on a record that simply doesn’t include the bad years.
Yield versus drawdown, honestly
The tradeoff is real but conditional:
- In a broad liquidity crash, dividend and income ETFs offer little downside protection. 2020 hit them nearly as hard as the S&P 500, and VYM harder.
- In a valuation or rate-driven bear, they protect well. 2022 saw all three beat SPY by 8 to 11 points, with the covered-call fund (JEPI) leading.
- Short track records flatter the newer funds. JEPI and SCHD have never faced a 2008-scale event; VYM has, and it fell 57%.
An income ETF is a bet on what kind of crash comes next, not a blanket safety upgrade. Check the live drawdown, recovery, and full crisis breakdown on the SCHD page, JEPI page, and VYM page. For how these funds combine in a portfolio, the portfolio drawdown tool computes the blended figure.
FAQ
Did dividend ETFs protect investors in the 2020 COVID crash? Barely. SCHD fell 32.8% and VYM fell 34.6% versus SPY’s 33.7%. In a fast liquidity-driven crash, dividend screens offered almost no cushion, and VYM fell slightly more than the S&P 500.
Which income ETF held up best in 2022? JEPI, at −13.7%, versus SPY’s −24.5%. Its covered-call income and value tilt suited a rate-driven bear. SCHD (−16.8%) and VYM (−15.8%) also beat the S&P 500 comfortably.
Is VYM safer than the S&P 500? Not by drawdown. VYM’s worst-ever decline is −57.0%, slightly deeper than SPY’s −55.2%, because its high-dividend basket was heavy in the financials that led the 2008 crash.
Methodology: crisis-window drawdowns are the maximum peak-to-trough decline inside each dated window, on adjusted daily closes; funds with no data in a window are shown blank rather than estimated. See the methodology page.