2026-07-04
QQQ vs SPY: 25 Years of Drawdowns Compared
By FinScope Research · Data as of 2026-07-02
QQQ and SPY are the two funds most American investors actually own. One tracks the Nasdaq-100, heavy in large-cap technology. The other tracks the S&P 500, the broad market. In a bull run QQQ usually wins and the choice feels obvious. The choice is really made in the crashes, and there the two funds behave very differently depending on which crash you’re in.
We measured both through the four defining drawdowns of the last 25 years, using each fund’s own adjusted daily closes.
Four crashes, side by side
Each cell is the maximum peak-to-trough drawdown inside that window, computed from daily data. The last column is how much deeper QQQ went, in percentage points.
| Crisis | QQQ max drawdown | SPY max drawdown | QQQ deeper by |
|---|---|---|---|
| Dot-com (2000–02) | −83.0% | −47.5% | 35.4 pp |
| Financial crisis (2008) | −53.4% | −55.2% | −1.8 pp |
| COVID (2020) | −28.6% | −33.7% | −5.2 pp |
| 2022 bear | −34.8% | −24.5% | 10.3 pp |
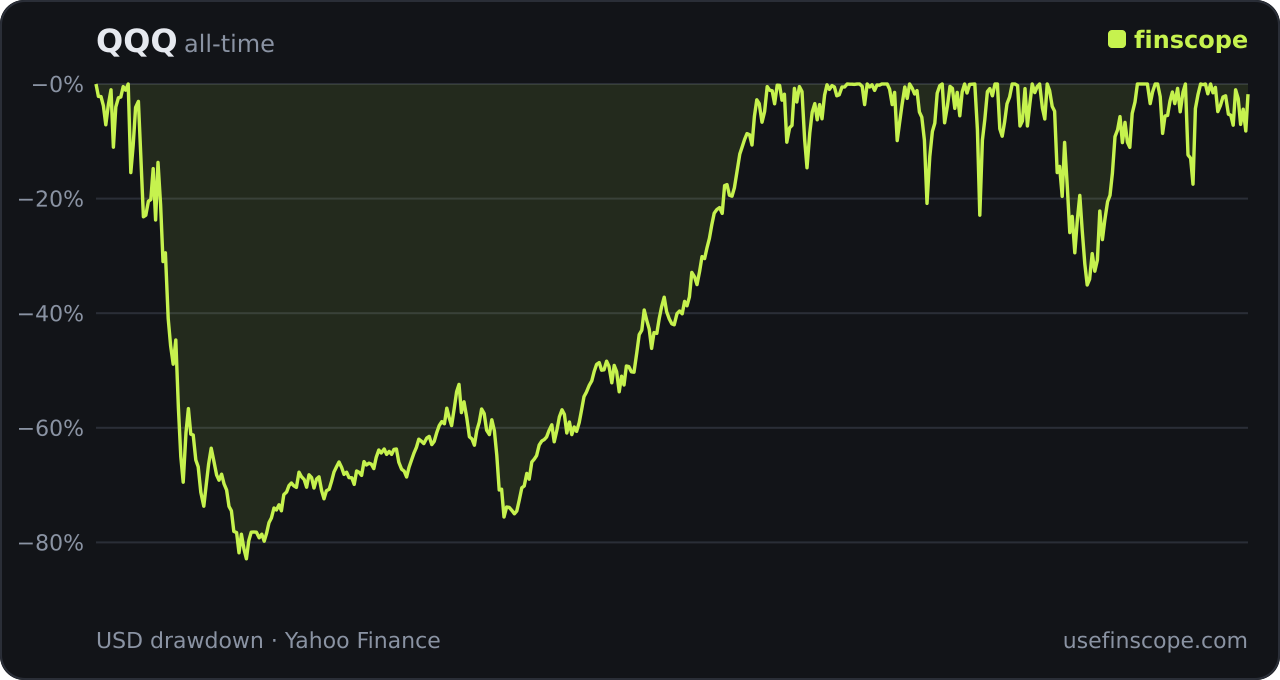
The headline is that the answer changes every crisis.
The dot-com crash was a Nasdaq event. QQQ fell 83.0% while SPY fell 47.5%, a 35-point gap and the widest in the table. This is the crash QQQ was built to lose. The Nasdaq-100 was the epicenter of the bubble, and concentration in the exact stocks that inflated the most turned into concentration in the exact stocks that collapsed hardest.
2008 was the one time SPY fell more. The financial crisis hit banks, housing, and the broad economy rather than technology specifically. SPY dropped 55.2%, slightly deeper than QQQ’s 53.4%. If you only remembered 2008, you’d wrongly conclude the two funds carry similar downside.
COVID favored QQQ. The 2020 crash was a fast, everything-down shock, but big tech was seen as a beneficiary of lockdowns. QQQ fell 28.6% against SPY’s 33.7% and recovered faster.
2022 was a Nasdaq event again. Rising rates repriced long-duration growth stocks first. QQQ fell 34.8% versus SPY’s 24.5%, a 10-point gap, and took longer to heal.
The all-time record is not close
Look past individual windows to each fund’s worst-ever drawdown and its longest stretch underwater:
| Fund | All-time max drawdown | Deepest episode | Days underwater |
|---|---|---|---|
| QQQ | −83.0% | 2000-03 → 2002-10 | 4,517 |
| SPY | −55.2% | 2007-10 → 2009-03 | 1,256 |
QQQ’s worst episode ran from March 2000 to October 2002 and did not fully recover until February 2015. That is 4,517 days, more than twelve years, underwater. SPY’s worst episode, the 2008 crash, recovered in 1,256 days, a little over three years. That is the real cost of the extra return QQQ delivers in good times: when it’s wrong, it’s wrong for a decade.
When each was the better hold
The pattern across 25 years is consistent enough to state plainly:
- When the shock originates in technology or long-duration growth (2000, 2022), QQQ falls harder and recovers slower. SPY is the better place to be.
- When the shock is broad or economic (2008), the two are close, and SPY can even fall slightly more.
- When the shock is short and tech is seen as a haven (2020), QQQ falls less and rebounds faster.
Over the full period QQQ’s total return has been higher, which is why it wins the long-run horse race. But an investor who bought QQQ at the 2000 top spent twelve years getting back to even, and that is a real outcome that a “QQQ beats SPY over time” chart quietly hides.
Neither fund is a mistake. The honest framing is that QQQ pays more and charges more: more return in trends, deeper holes and longer recoveries in the crashes that hit growth. Size the position for the −83%, not the average year.
What the split means for allocation
The two funds also overlap far more than most owners realize. The S&P 500 is now heavily weighted toward the same large-cap technology names that dominate the Nasdaq-100, so holding both does not diversify as much as the tickers suggest. In a growth-led sell-off like 2000 or 2022, they fall together, just by different amounts. If you own both, treat the pair as one concentrated technology position with a broad-market tail, not as two independent bets.
For a long horizon that can genuinely tolerate a decade underwater, QQQ’s higher return has historically paid off. For a shorter horizon, or for money you might need during the drawdown, SPY’s shallower crashes and faster recoveries are worth the lower expected return. The mistake is owning QQQ while planning around SPY’s risk profile. That is how a −83% drawdown turns a long-term plan into a forced sale at the bottom.
See the live drawdown and recovery record on the QQQ page and the SPY page, or compare the two directly. To model how a QQQ-and-SPY mix behaves in a crash, the portfolio drawdown tool computes the blended figure.
FAQ
Has QQQ or SPY fallen more historically? QQQ’s worst-ever drawdown is −83.0% (dot-com), far deeper than SPY’s −55.2% (2008). But in the 2008 crisis specifically, SPY fell slightly more than QQQ.
Which recovers faster after a crash? It depends on the crash’s cause. QQQ recovered faster from COVID; SPY recovered far faster from the dot-com crash, where QQQ stayed underwater for more than twelve years.
Is QQQ riskier than SPY? By drawdown depth and time-to-recover, yes, especially when the sell-off is driven by technology or growth. QQQ has historically delivered higher returns as compensation for that deeper downside.
Methodology: drawdowns are peak-to-trough declines on adjusted daily closes; windowed figures reset the peak at the start of each crisis window. Recovery counts calendar days from trough to the first reclaim of the prior high. See the methodology page.