2026-07-05
TQQQ’s −82%: What Leveraged ETF Drawdowns Actually Look Like
By FinScope Research · Data as of 2026-07-02
A 3x fund is supposed to give you three times the daily move of its index. Most people quietly assume that means three times the risk. It does not. It means three times the daily return, compounded every single day, and that daily reset does strange things to a drawdown. Over a bad stretch a 3x fund can lose far more than three times what its index lost, and in a choppy market it can bleed value even when the index goes nowhere.
We measured the real numbers on the three most-traded leveraged funds in our data and their plain-vanilla underlyings.
Leveraged versus 1x: the drawdowns are not proportional
Each all-time maximum drawdown below is computed from the fund’s own adjusted daily closes.
| Leveraged fund | Exposure | Max drawdown | 1x underlying | 1x max drawdown |
|---|---|---|---|---|
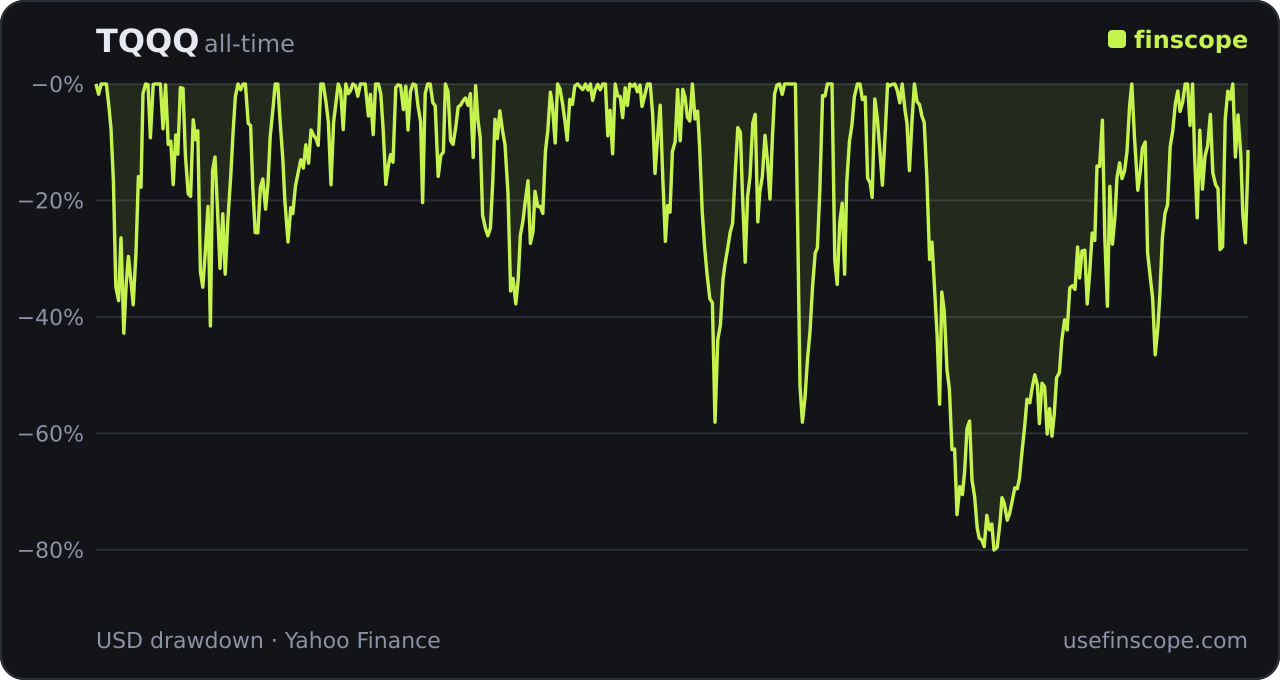
| TQQQ | 3x Nasdaq-100 | −81.7% | QQQ | −83.0% |
| SOXL | 3x semiconductors | −90.5% | SOXX | −70.2% |
| SQQQ | −3x Nasdaq-100 (inverse) | −100.0% | QQQ | −83.0% |
Start with SOXL. Its underlying semiconductor index (SOXX) had a worst-ever drawdown of 70.2%. The 3x version fell 90.5%. That is not 3 × 70% (you can’t lose 210%), but it is far worse than the underlying, and worse than a naive investor would budget for. Its 2022 episode ran from a December 2021 peak to an October 2022 trough at −90.5%, and it did not climb back to even until February 2026. More than three years underwater to undo a single bad year in chips.
TQQQ is the interesting one because its all-time drawdown (−81.7%) is actually shallower than QQQ’s (−83.0%). That is an accident of history: QQQ’s record drawdown was the 2000 dot-com crash, and TQQQ did not exist yet. It launched in February 2010. Over the window TQQQ has actually lived through, it is dramatically more volatile than QQQ. Its worst drawdown of −81.7% came in 2022, a year QQQ fell about 35%.
SQQQ, the inverse fund, shows the most brutal number in the table: an all-time drawdown of essentially −100%. A fund built to profit when the Nasdaq falls has been ground almost to zero by fifteen years of a mostly rising market. This is the fate of held inverse products.
Volatility decay, with real numbers
The clearest way to see decay is to compare a leveraged fund’s long-run return to three times its index’s return over the same window.
From TQQQ’s inception on 2010-02-11 through 2026-07-02:
| Metric | Value |
|---|---|
| QQQ total return | +1,782% |
| Naive “3× QQQ” (return only, no decay) | +5,346% |
| TQQQ actual total return | +35,497% |
Wait, TQQQ beat the naive 3x by a wide margin? Yes, and this is the part that gets leveraged ETFs misunderstood in both directions. During a long, strong, low-volatility uptrend, daily compounding works for you: each day’s gain is levered on top of the last, and the fund can outrun a simple 3x of the total return. The 2010s were exactly that kind of decade for the Nasdaq.
The catch is what happens in the other regime. Daily reset giveth in trends and taketh in chop. The same mechanism that produced +35,000% over sixteen mostly-up years is what produced the −81.7% hole in 2022 and the multi-year recovery. You are not holding “3x the Nasdaq.” You are holding a path-dependent bet that the Nasdaq keeps trending up without a long, violent, sideways fight.
The asymmetry that actually hurts
Leverage makes losses deeper than gains are tall, because of simple arithmetic. Down 50% requires up 100% to recover. A 3x fund reaches that −50% level on a roughly −17% move in its index, and it reaches −90%, where SOXL went, on drops that leave the underlying index badly bruised but nowhere near wiped out.
As of this data, TQQQ sits about 15.9% below its own peak while QQQ is only about 4.4% below its high. Same index, same day, and the leveraged version is more than three times further from even. That gap is the drawdown asymmetry in one line.
If you still want to use them
None of this makes leveraged ETFs useless. It makes them short-horizon, high-conviction tools, not buy-and-forget holdings. The math rewards trends and punishes long sideways grinds, and the drawdowns are deep enough that position sizing has to assume an 80–90% fall is on the table. For the full mechanics of daily reset, decay, and why the prospectuses themselves warn against holding, read the leveraged ETF guide. You can also pull the live drawdown and recovery record for any of these on the TQQQ page, SOXL page, or SQQQ page.
FAQ
What is TQQQ’s worst drawdown? Over TQQQ’s live history since 2010, its deepest peak-to-trough drawdown is −81.7%, reached at the end of 2022. QQQ, its 1x underlying, fell about 35% that same year.
Why did SOXL fall 90% when semiconductors only fell 70%? Daily 3x leverage compounds losses. A sustained decline in the underlying index drives the 3x fund down far more than three times as much over the full episode, because each day’s loss is levered on top of a smaller and smaller base.
Can a leveraged ETF beat 3x its index? In a long, strong uptrend with low volatility, yes: daily compounding can push the fund past a simple 3x of the index’s total return. In choppy or falling markets the same mechanism causes decay and severe drawdowns.
Methodology: drawdowns and returns are computed from each fund’s split- and dividend-adjusted daily closes; the “naive 3x” figure multiplies the underlying’s total return and ignores path and decay by design. See the methodology page.