2026-07-06
How Deep Do Stock Market Crashes Go? Every S&P 500 Drawdown Since 1993, Measured
By FinScope Research · Data as of 2026-07-02
Ask ten investors how far the market can fall and you get ten guesses. The record is not a guess. Since SPY began trading on January 29, 1993, the fund has logged 8,413 daily closes, and every drawdown inside that history can be measured exactly: how far it fell, how long it stayed down, and when it got back to even.
We walked the full adjusted-close series and pulled out the eight deepest peak-to-trough episodes. An episode starts at an all-time high, runs to its lowest point, and ends the day that high is reclaimed. The deepest of them all is the number most people already half-remember: the 2007–2009 crash took SPY down 55.2%.
The eight worst S&P 500 drawdowns since 1993
Every figure below is computed from SPY’s own daily closes. “Days underwater” counts calendar days from the trough to the day the prior high was recovered.
| Peak | Trough | Depth | Recovered | Days underwater |
|---|---|---|---|---|
| 2007-10-09 | 2009-03-09 | −55.2% | 2012-08-16 | 1,256 |
| 2000-03-24 | 2002-10-09 | −47.5% | 2006-10-26 | 1,478 |
| 2020-02-19 | 2020-03-23 | −33.7% | 2020-08-10 | 140 |
| 2022-01-03 | 2022-10-12 | −24.5% | 2023-12-13 | 427 |
| 2018-09-20 | 2018-12-24 | −19.3% | 2019-04-12 | 109 |
| 1998-07-20 | 1998-08-31 | −19.0% | 1998-11-23 | 84 |
| 2025-02-19 | 2025-04-08 | −18.8% | 2025-06-26 | 79 |
| 2015-07-20 | 2016-02-11 | −13.0% | 2016-04-18 | 67 |
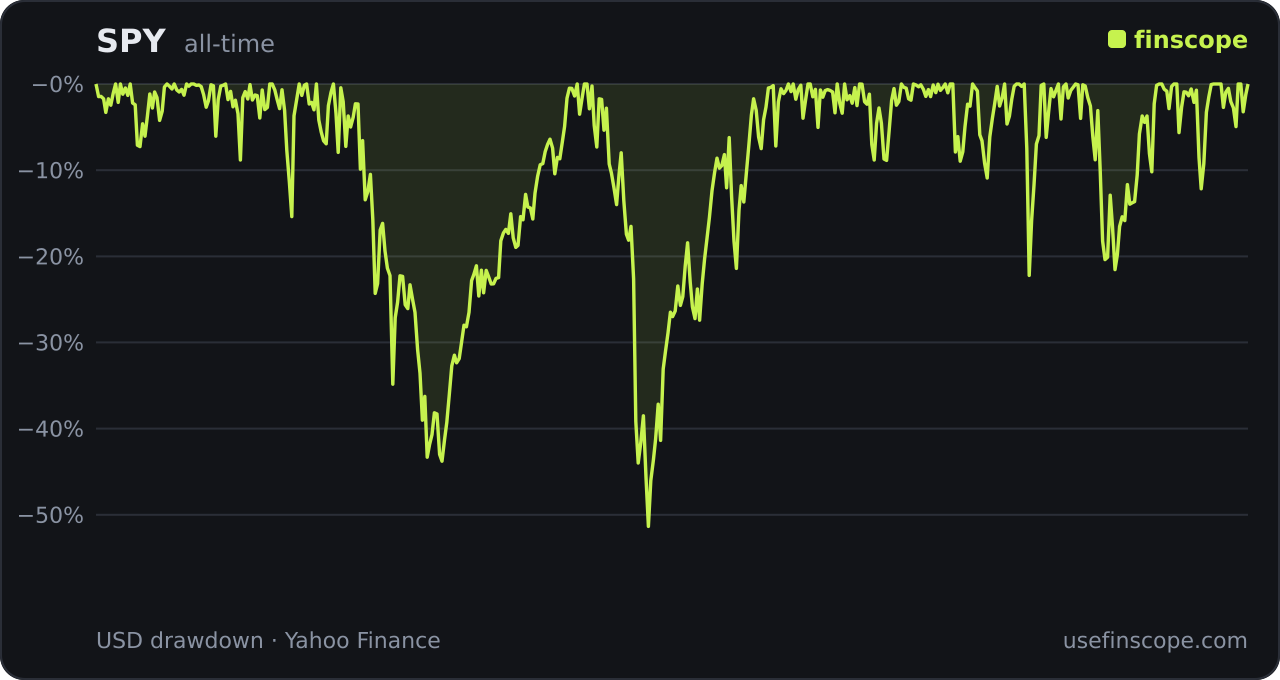
A few things jump out of that table.
The two big ones stand alone. The dot-com unwind and the financial crisis both cut the index roughly in half, and both took years to repair. The 2000 peak was not reclaimed until late 2006, and by then the next crash was already twelve months away. An investor who bought SPY at the March 2000 top spent the better part of a decade underwater across two separate bear markets.
Everything else recovered inside two years. The COVID crash was violent but brief: down 33.7% in 33 calendar days, back to even in under five months. The 2018 December selloff, the 1998 Long-Term Capital scare, and the spring-2025 tariff drop all healed in under a year. Speed of decline tells you almost nothing about time to recover. The −33.7% COVID hole closed faster than the shallower −24.5% grind of 2022.
How often does the S&P 500 actually fall this much?
Across the full 33-year record, SPY had 12 separate episodes deeper than 10%, and only four of the top eight fell more than 20%. Corrections of 10% to 20% are routine; the market delivered one every few years. Losses past 30% are rare and cluster in genuine crises: 2008, 2020, and the front edge of the dot-com collapse.
That ratio is the useful part. A 10% pullback is not a signal that a 50% crash is coming, because most 10% pullbacks stop there. The deep ones look different early. They are driven by a systemic shock (credit in 2008, a pandemic in 2020, a valuation reset in 2000) rather than ordinary volatility.
Broad market versus growth and small caps
SPY is the calm sibling. Run the same walk on a growth-heavy index and a small-cap index and the holes get deeper.
| Fund | Coverage | All-time max drawdown | Trough |
|---|---|---|---|
| SPY | S&P 500 | −55.2% | 2009-03-09 |
| QQQ | Nasdaq-100 | −83.0% | 2002-10-09 |
| IWM | Russell 2000 small caps | −58.6% | 2009-03-09 |
QQQ, concentrated in large-cap technology, fell 83.0% when the dot-com bubble burst. Its worst point came in October 2002, well after SPY had found a temporary floor. Small caps (IWM) bottomed on the same March 2009 day as SPY but fell further, to −58.6%. The lesson is not that broad beats concentrated in every window; it is that the S&P 500’s −55% is a floor for diversified US equity, and the further you tilt toward growth or small size, the deeper the worst case runs. Our QQQ versus SPY drawdown comparison breaks that difference down episode by episode.
What to take from the numbers
Three practical reads:
- A diversified US index has, historically, been capable of losing about half its value in a real crisis. Position sizing should assume that can happen again, not that it can’t.
- Recovery is the harder variable. Depth is over in months; getting back to even took SPY more than three years after 2008 and more than six after 2000.
- Most drawdowns are shallow and fast. Reacting to every 10% dip as if it were 2008 is its own kind of mistake.
You can see the live drawdown, current distance from the high, and full recovery breakdown for any ticker on its FinScope page. Start with the S&P 500 drawdown page, or screen the whole universe by depth in the drawdown screener.
FAQ
What is the largest S&P 500 drawdown on record here? Measured from SPY’s daily closes since 1993, the deepest peak-to-trough decline is −55.2%, from the October 2007 high to the March 9, 2009 low. It was fully recovered on August 16, 2012.
How long does it take the S&P 500 to recover from a crash? It depends entirely on the crash. The COVID drop recovered in 140 days from its trough; the 2008 low took 1,256 days, and the 2000 peak was not reclaimed for more than six years across two bear markets.
Is a 10% drop a warning of a bigger crash? Not reliably. SPY had 12 declines past 10% since 1993, but only a handful ran past 30%. Most corrections stop in the 10–20% range.
Methodology: drawdowns are computed as peak-to-trough declines on split- and dividend-adjusted daily closes; an episode ends when the prior peak is reclaimed. Full details on the methodology page.