2026-07-10
SOXL vs SMH: How Much Deeper a 3x Semiconductor ETF Falls
By FinScope Research · Data as of 2026-07-08
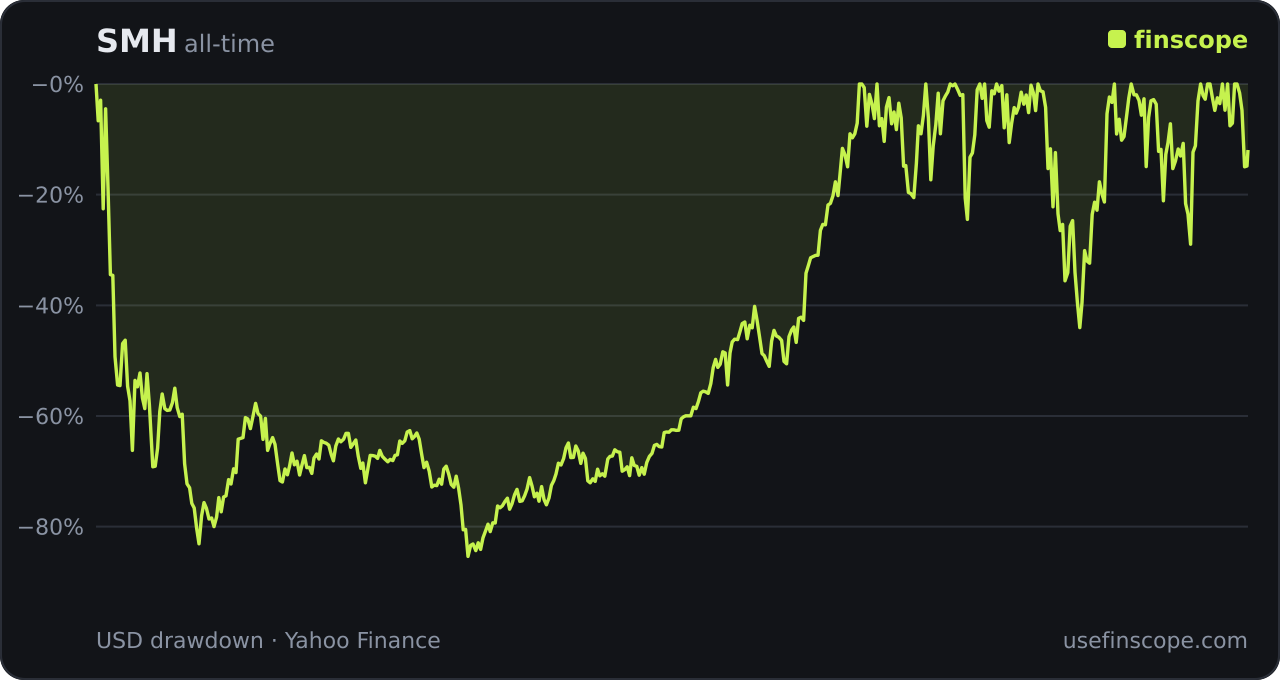
Semiconductors are already one of the most violent corners of the US market. SMH, the VanEck semiconductor fund, has a worst-ever drawdown of −85.9%. SOXL takes that volatility and multiplies the daily move by three. The result is not three times the risk in any simple sense. It is a fund that has fallen −90.5% from a peak, sat underwater for more than three years, and still, over its full life, outran a naive 3x of the sector. Both of those facts are true at once, and that is the whole point of this comparison.
We measured both funds from their own split- and dividend-adjusted daily closes.
Two funds, two very different worst cases
SMH has the longer history, back to June 2000, so its record drawdown is the dot-com collapse that ran all the way into the 2008 trough. SOXL launched in March 2010 and never lived through that. Read the table with that gap in mind.
| Metric | SOXL | SMH |
|---|---|---|
| First data date | 2010-03-11 | 2000-06-05 |
| All-time max drawdown | −90.5% | −85.9% |
| Worst peak / trough | 2021-12-27 / 2022-10-14 | 2000-06-21 / 2008-11-20 |
| Days underwater (that episode) | 1,230 | 3,247 |
| Current decline from peak | −41.9% | −11.3% |
| Latest price | $174.82 | $593.00 |
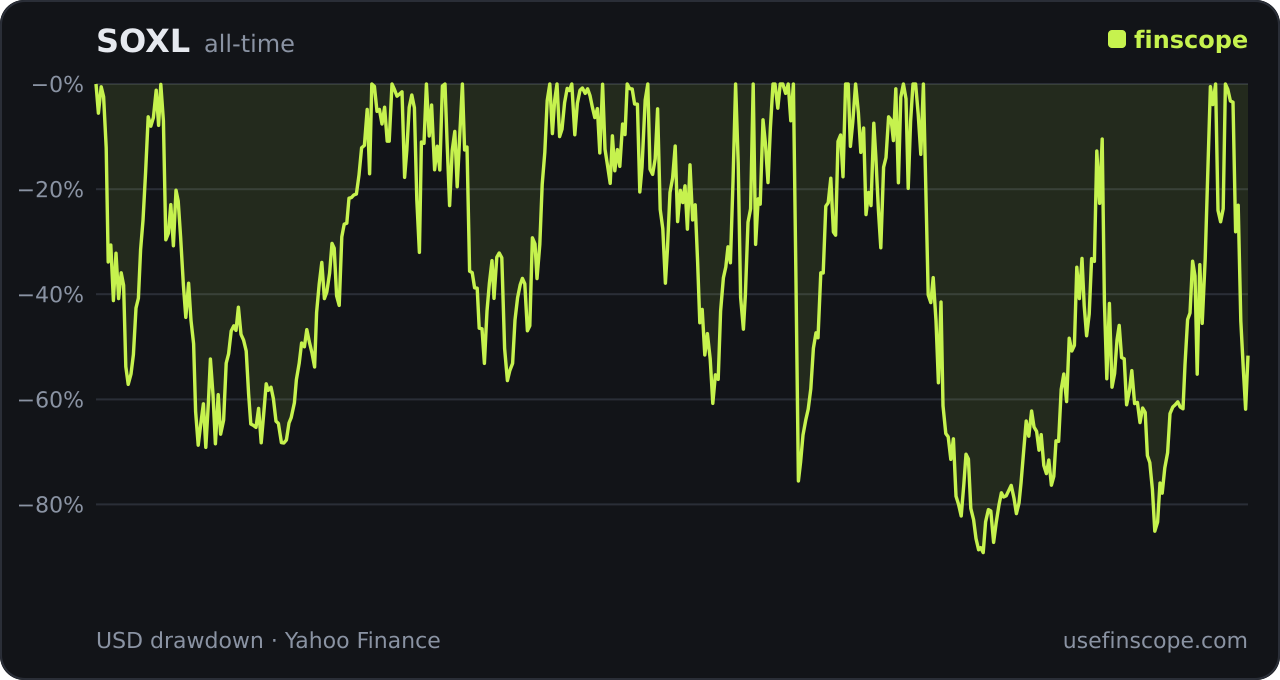
On paper SOXL’s −90.5% is only about 4.5 points deeper than SMH’s −85.9%, which sounds almost close. It isn’t. SMH’s −85.9% is a once-in-a-generation event, the bursting of the largest tech bubble in modern history stretched over eight years. SOXL reached a deeper number in ten months, from a December 2021 peak to an October 2022 trough. A −90.5% drawdown leaves about 9.5 cents of every dollar bought at the top. It then took until February 2026 to climb back to even: 1,230 days, more than three years, to undo a single bad year in chips.
The current-decline column is where the day-to-day gap shows. SMH sits just −11.3% below its high. SOXL is still −41.9% below its own peak. Same sector, same trading day, and the leveraged fund is nearly four times further from recovery.
The same crash, more than twice the hole
The cleanest way to see what 3x does is to put both funds inside the exact same crisis window and reset the peak at the start of each one.
| Crisis window | SOXL max drawdown | SMH max drawdown | SOXL deeper by |
|---|---|---|---|
| COVID (2020) | −80.4% | −33.6% | 46.8 pp |
| 2022 bear | −90.3% | −45.1% | 45.2 pp |
In the COVID crash SMH fell −33.6% and healed within a few months. SOXL fell −80.4% in the same 30-day plunge. In 2022 SMH fell −45.1% while SOXL fell −90.3%. Notice the multiple: SOXL dropped roughly twice as deep as SMH, not three times. That is the first surprise of daily leverage. On the way down the 3x fund does not fall a clean 3x, because each day’s loss lands on a smaller base. Three times −45% is mathematically −135%, and you cannot lose more than everything. The same compounding that caps the raw downside at “only” −90% is what does the real damage over time.
When the leverage paid, and when it destroyed
Here is the part that gets 3x funds misunderstood. Over SOXL’s entire life, daily leverage did not quietly bleed it to death. It built an enormous paper gain for anyone who held from the start and never sold.
| 2010-03-11 to 2026-07-08 | Total return |
|---|---|
| SMH (1x) | +5,053.7% |
| Naive “3× SMH” (no path, no decay) | +15,161.2% |
| SOXL (actual) | +28,994.8% |
SOXL did not just beat SMH. It beat a naive 3x of SMH by more than 13,000 points. During a long, strong, mostly upward trend, the daily reset works in your favor: each up day compounds on top of the last, and the fund can outrun a simple multiple of the sector’s total return. From inception to its December 2021 peak, SOXL returned +11,688% while SMH returned +1,242%. That is the bull case for the fund, and it is real.
The destruction is the other regime. The same mechanism that produced +11,688% in the uptrend produced the −90.5% collapse when the trend broke, and then a three-year climb out. You were never holding “SMH times three.” You were holding a bet that semiconductors keep trending up without a long, violent fight. When that bet is right it pays spectacularly. When it is wrong, the hole is deep enough that position sizing has to assume a −90% fall is on the table.
This is the same daily-reset math we broke down for the Nasdaq in TQQQ’s −82%. Semiconductors just run hotter than the Nasdaq, so every number here is more extreme.
Why the recovery is the real cost
Leverage bends losses and gains apart. Down 50% needs up 100% to get back. Down 90%, where SOXL went, needs up 900%. A 1x fund like SMH reaches its lows on a sector decline that is painful but survivable, and it climbs back in a normal cycle. The 3x fund reaches −90% on the same sector move, and then needs a far larger rally just to break even.
That asymmetry is why the current-decline gap matters more than the headline drawdown. “The sector recovered” and “my leveraged fund recovered” are different sentences. SMH has essentially healed, −11.3% from its high. SOXL, after a powerful 2023 to 2025 semiconductor rally, is still −41.9% below its peak. The move that healed the underlying has not yet healed the 3x fund.
If you still want to use SOXL
None of this makes SOXL useless. It makes it a short-horizon, high-conviction tool rather than a buy-and-hold semiconductor position. The math rewards clean trends and punishes long choppy stretches, and the drawdowns are deep enough that a single mistimed entry can take years to recover. If your plan is to own the semiconductor cycle for a decade, SMH carries the sector’s own considerable risk without the daily-reset penalty. If you want SOXL’s upside, size the position for the −90%.
Pull the live drawdown, recovery record, and current decline for either fund on the SOXL page and the SMH page, and read the full mechanics in the leveraged ETF guide.
FAQ
What is SOXL’s worst drawdown? Over SOXL’s live history since 2010, its deepest peak-to-trough drawdown is −90.5%, from a December 2021 peak to an October 2022 trough. It did not reclaim that prior high until February 2026, 1,230 days later.
Did SOXL fall three times as much as SMH? Not on the downside. In the 2022 bear SOXL fell −90.3% versus SMH’s −45.1%, about twice as deep, not three times. Daily 3x leverage cannot produce a clean 3x loss, because you cannot lose more than 100%. The leverage shows up most in the long recovery and in choppy markets.
Is SOXL a good long-term hold? Historically it has produced huge returns in the semiconductor uptrend, beating even a naive 3x of SMH since 2010. But it does so with −80% to −90% drawdowns and multi-year recoveries. It behaves like a trading tool, not a set-and-forget holding.
Methodology: drawdowns and returns are computed from each fund’s split- and dividend-adjusted daily closes; windowed figures reset the peak at the start of each crisis window; the “naive 3×” figure multiplies SMH’s total return by three and ignores path and decay by design. SOXL’s stated objective tracks a semiconductor index rather than SMH itself, so SMH is used here as the liquid 1x sector benchmark. See the methodology page.