2026-07-05
How Long Does the Market Take to Recover? Recovery Times for 800+ US Stocks and ETFs
By FinScope Research · Data as of 2026-07-02
Everyone talks about how far a stock falls. Far fewer people ask the question that actually decides whether you can hold it: once it bottoms, how long until it gets back to where you bought? For a single-name investor, time underwater is the real cost. A 90% crash that recovers in two years is survivable. A 60% crash that takes eighteen years is a different life.
We measured it across the FinScope universe of 814 US stocks and ETFs, using each security’s worst drawdown episode and the number of calendar days from its trough back to the old high. The spread is enormous, and it splits cleanly by what kind of instrument you own.
Recovery time by asset type
Grouping the universe into single stocks, plain ETFs, and leveraged or inverse ETFs, then measuring recovery in years, gives three very different distributions.
| Asset type | Count | Median | 25th pct | 75th pct | 90th pct | Longest |
|---|---|---|---|---|---|---|
| Single stocks | 436 | 3.7 yr | 1.8 yr | 6.4 yr | 10.7 yr | 22.9 yr |
| Plain ETFs | 152 | 2.1 yr | 1.2 yr | 4.6 yr | 8.7 yr | 15.5 yr |
| Leveraged / inverse ETFs | 19 | 1.0 yr | 0.5 yr | 2.5 yr | 3.6 yr | 4.8 yr |
Read the median column first. A typical single stock that fell into a real drawdown needed 3.7 years to reclaim its high. A typical ETF needed about 2.1 years. Diversification does not stop the fall, since plenty of index funds dropped 30% or 50%, but it shortens the climb back, because an index does not carry the single-company risk of never recovering at all.
The leveraged row looks fast, and that number is a trap we cover below.
The longest recoveries on record
The tail is where the danger lives. These are the eleven securities in our universe with the longest recovery episodes, ranked by days underwater.
| Ticker | Name | Max drawdown | Days underwater | ~Years | Trough |
|---|---|---|---|---|---|
| GLW | Corning | −99.0% | 8,373 | 22.9 | 2002-10-08 |
| MSTR | Strategy (MicroStrategy) | −99.9% | 8,144 | 22.3 | 2002-07-26 |
| NTAP | NetApp | −96.2% | 7,897 | 21.6 | 2002-10-08 |
| CSCO | Cisco Systems | −89.3% | 6,895 | 18.9 | 2002-10-08 |
| PWR | Quanta Services | −97.1% | 6,583 | 18.0 | 2002-10-07 |
| A | Agilent Technologies | −93.2% | 6,507 | 17.8 | 2002-10-10 |
| VRSN | VeriSign | −98.4% | 6,112 | 16.7 | 2002-10-08 |
| PTC | PTC Inc. | −95.3% | 5,691 | 15.6 | 2002-10-10 |
| RF | Regions Financial | −92.6% | 5,684 | 15.6 | 2009-02-04 |
| FLEX | Flex Ltd. | −96.4% | 5,668 | 15.5 | 2008-11-20 |
| INTC | Intel | −82.2% | 5,628 | 15.4 | 2002-10-08 |
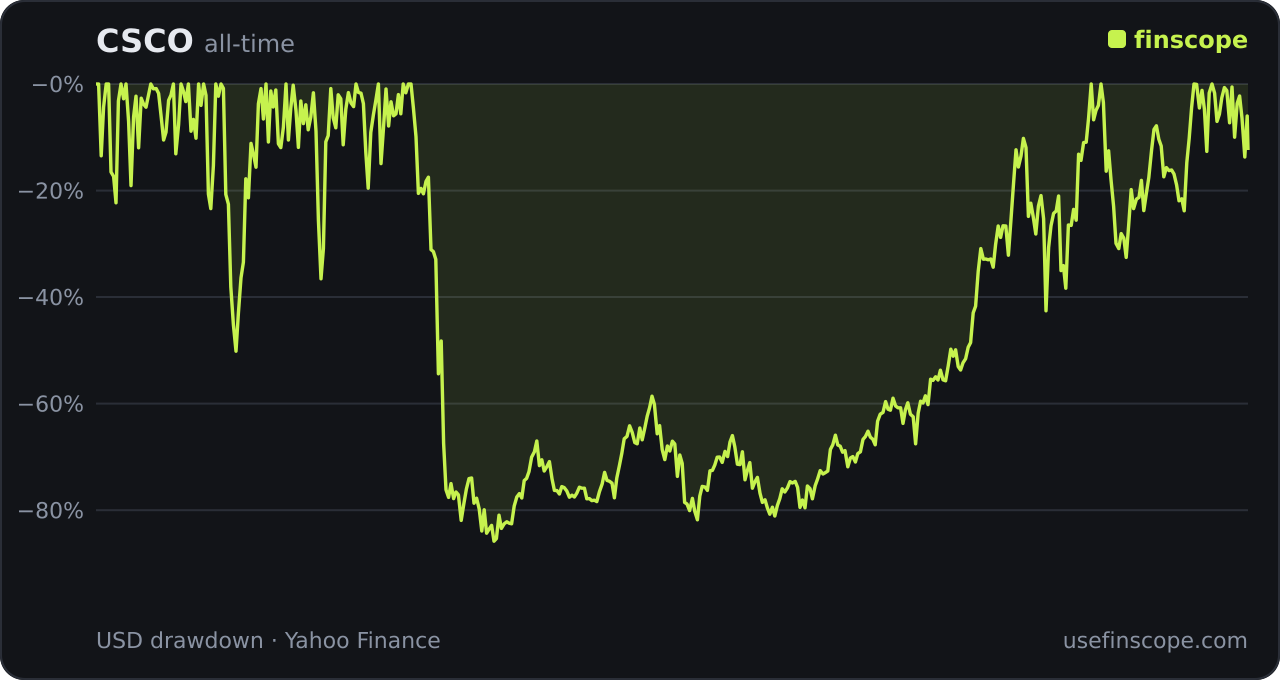
Almost every name on that list shares one date: the trough sits in late 2002 or the 2008–2009 window. These are the dot-com casualties. Cisco is the textbook case. It was one of the most valuable companies on earth in March 2000, fell 89%, and did not see that price again until 2026: nearly nineteen years trough to recovery. Intel took more than fifteen. Corning needed almost twenty-three.
Here is the part that surprises people: they did recover. As of this data, Cisco is only about 13% below its all-time high and Intel about 15% below, because both finally pushed past their 2000 peaks. The story is not “these stocks never came back.” It is “these stocks came back, and it took the better part of two decades.” If your holding period is shorter than that, an eventual recovery is cold comfort.
Why the leveraged numbers lie
The leveraged and inverse ETFs show the fastest recoveries in the table at the top, a one-year median. Do not read that as safety. Daily-reset leveraged funds recover quickly from small dips because they amplify the bounce, but they also decay in choppy markets and can post drawdowns that a normal fund physically cannot. Several 3x products in our data show all-time drawdowns at or near −100%, from which there is effectively no recovery at all; those permanent losses drop out of a “days underwater” statistic because the fund never gets back to even, which flatters the survivors that remain. We pull that behavior apart in what leveraged ETF drawdowns actually look like and in the leveraged ETF guide.
What this means for a buy-and-hold investor
- The fall is the headline; the recovery is the cost. A single stock’s median trip back to even was 3.7 years, and the tail runs past twenty.
- Index funds cut recovery time roughly in half versus single stocks, mostly by removing the risk that one company simply never comes back.
- “It always recovers” is survivorship bias wearing a suit. The companies that recovered are still listed; many that didn’t were acquired or delisted and never appear in a recovery table at all.
Check the exact recovery breakdown for anything you own on its FinScope page, or sort the whole universe by recovery time in the drawdown rankings. For the framework behind these numbers, see the recovery-time guide.
FAQ
How long does a typical stock take to recover from a drawdown? In this universe, the median single stock needed about 3.7 years from its trough to reclaim its prior high. A quarter recovered inside 1.8 years; the slowest tenth took more than a decade.
Did the dot-com stocks ever recover? Many did, but slowly. Cisco took roughly nineteen years and Intel more than fifteen to get back to their 2000 highs. Both are now within about 15% of a fresh all-time high, a full generation after the crash.
Do ETFs recover faster than individual stocks? On average, yes. The median ETF recovery here was about 2.1 years versus 3.7 for single stocks, because an index does not carry the risk that a single company disappears.
Methodology: recovery time is calendar days from a security’s drawdown trough to the first close that reclaims the prior peak, on adjusted daily prices. Securities still below their high are counted as ongoing. See the methodology page.