2026-07-10
TSLL vs TSLA: The 2x ETF That Fell While Tesla Rose
By FinScope Research · Data as of 2026-07-08
Tesla is already one of the hardest stocks in the market to hold. TSLA has fallen more than 70% from a peak and lost roughly half its value on four separate other occasions. TSLL is a fund that delivers two times Tesla’s daily move, so you would expect a rougher ride. What actually happened over TSLL’s short life is stranger than rougher: Tesla the stock rose +39.1%, and TSLL the 2x fund fell −40.3%. Same company, same window, opposite signs.
That one fact is the clearest lesson a leveraged single-stock ETF can teach. We can only show it honestly by being strict about the window.
The short history is the first caveat
TSLL launched on 2022-08-09. It has no data before that, so there is no honest way to compare it to TSLA through Tesla’s 2022 crash, the 2020 COVID plunge, or any of Tesla’s earlier collapses. Every TSLL number here is measured only from August 2022 forward, and every TSLL-versus-TSLA comparison uses that same common window. Where we quote TSLA’s deeper history, it is labeled clearly as TSLA’s own record, not a matchup.
With that stated plainly, here is what each one looks like.
Tesla’s own drawdowns were already brutal
Before any leverage, TSLA carries one of the roughest drawdown records of any large US stock. Measured from its own adjusted daily closes across its full history:
| # | Peak → trough | Drawdown | Days to trough | Days underwater |
|---|---|---|---|---|
| 1 | 2021-11-04 → 2023-01-03 | −73.6% | 425 | 708 |
| 2 | 2020-02-19 → 2020-03-18 | −60.6% | 28 | 82 |
| 3 | 2024-12-17 → 2025-04-08 | −53.8% | 112 | 252 |
| 4 | 2017-09-18 → 2019-06-03 | −53.5% | 623 | 198 |
| 5 | 2014-09-04 → 2016-02-10 | −49.8% | 524 | 418 |
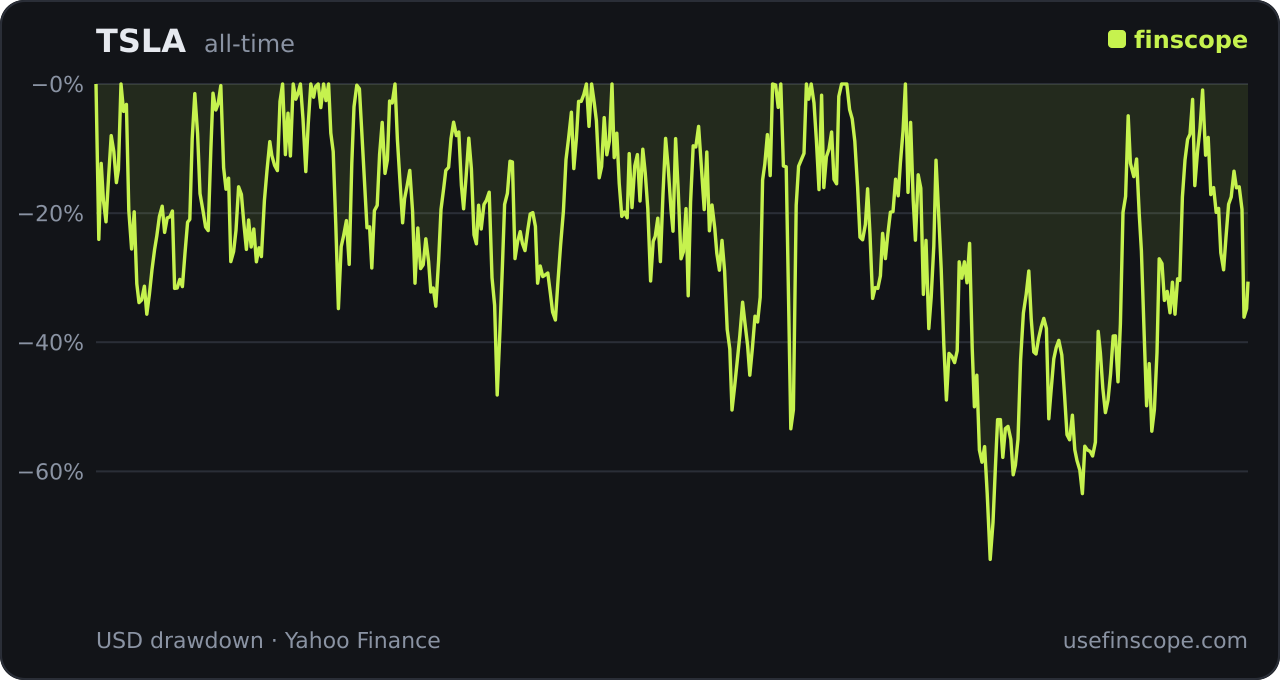
TSLA’s worst episode is the −73.6% fall from its November 2021 peak to the January 2023 trough. It took 708 days to reclaim that high, finally getting there in December 2024. That is the underlying, the 1x stock. Beyond it, TSLA lost roughly half its value four separate other times. This is the raw material TSLL doubles.
Note the current-decline line too. As of this data TSLA is only −19.6% below its all-time high, having recovered and rolled over again. A stock can be near its highs and still own a drawdown record like this. Both facts coexist.
TSLL’s record is short, and worse
TSLL has existed for under four years, and in that time it has already carved two enormous holes.
| # | Peak → trough | Drawdown | Days to trough | Recovered |
|---|---|---|---|---|
| 1 | 2024-12-17 → 2025-04-21 | −82.9% | 125 | Not yet |
| 2 | 2022-08-15 → 2023-01-03 | −81.2% | 141 | 2024-12-06 |
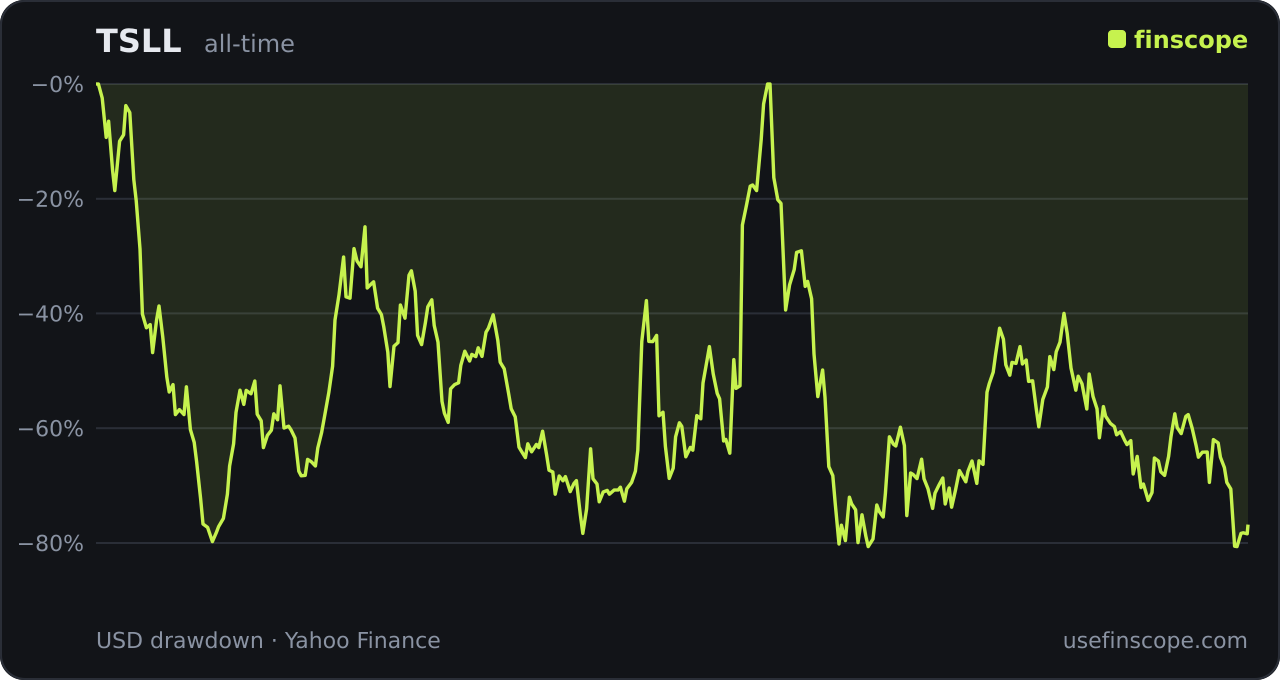
Its worst is −82.9%, from the December 2024 peak to an April 2025 trough, and as of this data it has not recovered. Its first drawdown, right after launch, was −81.2% and took until December 2024 to heal, 703 days underwater. So in under four years TSLL has spent most of its life deep below a prior high. Its current decline from peak is −67.1%, against −19.6% for TSLA. The stock is near its highs; the 2x fund is two-thirds of the way to zero from its own.
The decay, in one honest window
Now the number that ties it together. Over the exact span TSLL has existed, from 2022-08-09 to 2026-07-08:
| 2022-08-09 to 2026-07-08 | Value |
|---|---|
| TSLA total return | +39.1% |
| Naive “2× TSLA” (no path, no decay) | +78.2% |
| TSLL actual total return | −40.3% |
| TSLL max drawdown in window | −82.9% |
| TSLA max drawdown in window | −65.1% |
Read the top block again. The underlying stock went up 39.1%. A naive doubling would have been +78.2%. The actual 2x fund went down 40.3%. TSLL did not lag a naive 2x by a little. It lagged by about 118 percentage points and crossed from positive to negative. This is volatility decay in its purest form, and Tesla is the ideal stock to produce it. Huge up days and huge down days, over and over, are exactly the pattern that grinds a daily-reset fund down even when the stock ends higher.
The mechanism is simple arithmetic. A stock that drops 10% and then rises 10% is not back to even; it is down 1%. Double the daily moves and that gap widens quickly. Repeat it hundreds of times on a stock as choppy as Tesla and the leveraged fund can bleed away a positive underlying return entirely. The −82.9% drawdown is the dramatic number. The −40.3% total return against a +39.1% stock is the one that should change how you hold it.
Why a 2x single-stock ETF is not “TSLA times two”
TSLL seeks two times TSLA’s daily return. The word carrying all the weight is daily. Hold it for one day and it behaves as advertised. Hold it across the choppy, multi-month path Tesla actually travels, and compounding takes over. A sharp Tesla rebound helps TSLL, but it begins from a base already lowered by the previous drawdown, so it needs a bigger percentage move just to catch up.
That path dependency is why single-stock leverage needs its own risk lens, separate from owning the company. The leveraged ETF guide walks through the full daily-reset mechanics, and the same math played out on a 3x index fund in TQQQ’s −82%.
The takeaway
If you want exposure to Tesla for more than a day or two, TSLA itself already delivers a −73.6% worst case and four other drops of roughly half. TSLL adds a −82.9% hole, a current −67.1% decline, and a documented ability to lose money while the stock makes it. It is a short-horizon trading instrument whose main risk is not only depth but time: the longer you hold through Tesla’s chop, the more the daily reset works against you.
Check the live drawdown and recovery record on the TSLL page and the TSLA page before sizing either.
FAQ
Has TSLL fallen more than TSLA? Yes, on every measure available. Since TSLL launched in August 2022 its worst drawdown is −82.9% versus TSLA’s −65.1% over the same window, and its current decline from peak is −67.1% versus −19.6% for TSLA.
Why did TSLL lose money when Tesla went up? From 2022-08-09 to 2026-07-08 TSLA returned +39.1% while TSLL returned −40.3%. Daily 2x leverage decays in choppy markets: a down day followed by an up day does not fully recover, and doubling the moves widens that gap. Over a volatile stock like Tesla it can erase a positive return.
Can I compare TSLL to TSLA before 2022? No. TSLL did not exist before August 2022, so it has no data through Tesla’s 2022 crash or any earlier drawdown. Any comparison has to start at TSLL’s launch, which is what this article does.
Methodology: drawdowns and returns are computed from each security’s split- and dividend-adjusted daily closes; TSLL figures use only its live history since 2022-08-09; the common-window comparison and the “naive 2×” figure (TSLA’s total return doubled, ignoring path and decay) are measured over the identical 2022-08-09 to 2026-07-08 span. See the methodology page.